Lab 6: Obstruent Place of Articulation
Thomas Kettig, based on work by Sonya Bird et al.
Goal of Lab 6:
In this lab, we are going to explore the acoustic correlates of obstruent place of articulation. We shall see that the location of these correlates differ in stops vs. fricatives: while they are mainly “intrinsic” (within the consonant) for fricatives, they are mainly “extrinsic” (in the transitions to adjacent vowels) for stops.
RECORDING
Go to eClass and download the Lab6 sound files listed in the table below.
| File name | Sounds to record |
|---|---|
| Lab6_a_stop_a.wav | apa, aba, ata, ada, aka, aga |
| Lab6_i_stop_i.wav | ipi ibi, iti, idi iki, igi |
| Lab6_a_fricative_a.wav | afa, aθa, asa, aʃa, aha |
INSTRUCTIONS
SECTION I. STOP CONSONANTS
Several acoustic correlates distinguish different places of articulation in stops. The main ones are:
- VOT
- Spectral pattern during aspiration (voiceless stops)
- Transition into the adjacent vowels
We will focus on formant transitions in this section. Focus on the differences associated with place of articulation (i.e. the differences between /p b/, /t d/ and /k g/.
- Open the following sound files in Praat:
“Lab6_a_stop_a.wav” and
“Lab6_i_stop_i.wav”
- Focus on the voiced stops for now.
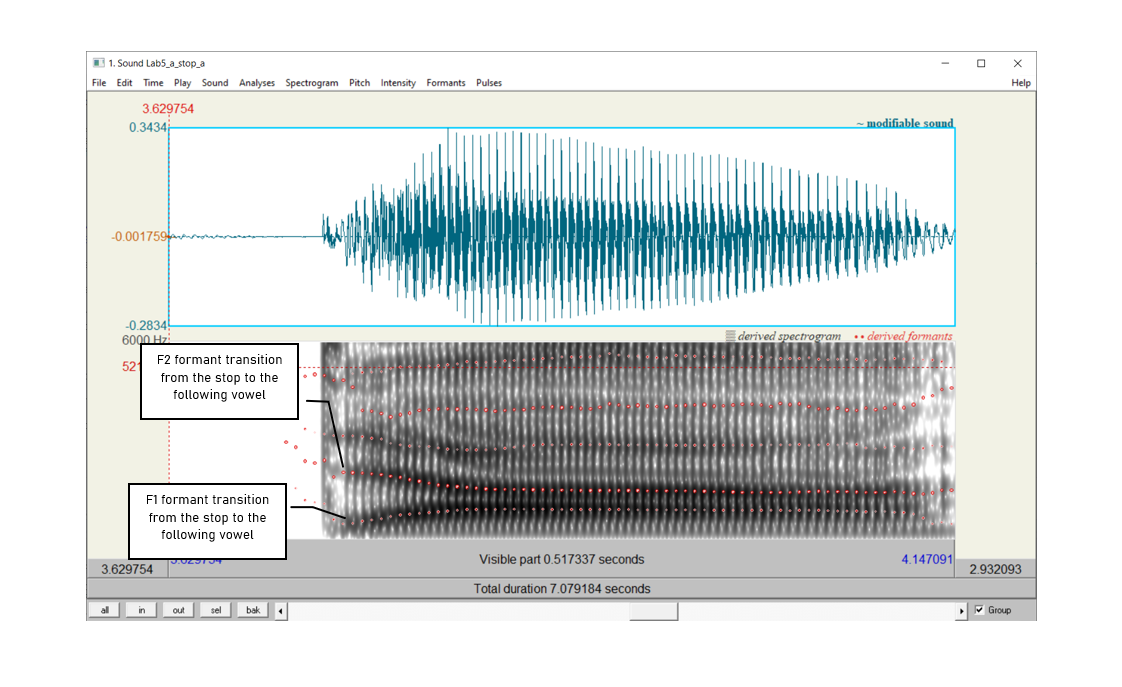
- In Table 6.1, note the F2 formant transition shape (and F1 if you can see it) between each voiced stop and the following [a] or [i] vowel (see Figure 6.1). Zoom so that you can clearly see the formant transitions from the stop into the following vowel. You can make a little sketch, or describe the shape in words.
TIP:
I find that zooming in too close or zooming out too far make doing this difficult, so if you have about 0.5 to about 1 second visible in your window, that should be good.
You may also want to change your spectrogram settings such that the ceiling is lower, maybe as low as 2000 Hz. This will “zoom in” along the y-axis in such a way that it will make the transition a bit clearer. Remember that we’re looking for what might be quite subtle formant transitions right where the stop burst turns into the first ~2-5 beats of the vocal folds.
SECTION II. FRICATIVES
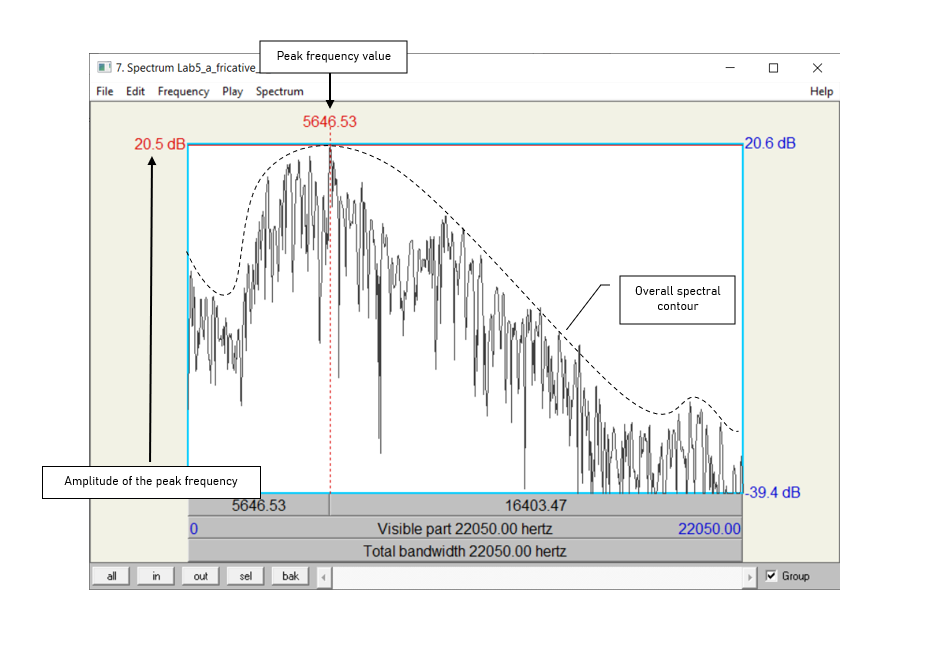
Different places of articulation in fricatives are correlated with two main properties: spectral content and relative amplitude. By examining the overall spectral contour, peak frequency and the amplitude of peak frequency, we can have an idea of the properties of a fricative.
- Use Table 6.2 to fill in the measurements you take on these three dimensions and compare between fricatives of different POA.
For this portion of the lab, make sure that the spectrogram is set to display frequencies up to 9,000 Hz:
Spectrum > Spectrogram settings…
View range: up to 9,000 Hz
Open the following sound file in Praat: Lab6_a_fricative_a.wav
Select approximately 50-60ms in the middle of each fricative (where the sound is most stable)
Spectrum > View spectral slice
For each fricative:
- Take a screenshot of the spectral slice and paste it into your lab document. Be sure to give the spectral slice an appropriate title.
- Note down the spectral peak in Table 6.2: the frequency or frequencies around which most of the energy is centered, i.e. the highest amplitude frequencies (the highest peaks)
- Note down the amplitude of the peak frequency in Table 6.2 (this is the amplitude of the frequency noted in the previous bullet point). Note that the positive dB values are louder than the negative dB values.
TIP:
You can also get a good idea of the frequency ranges and their relative amplitudes by looking at the spectrogram.For English, ‘ballpark’ measurements for [s] will be around 9,000Hz or higher, and for [ʃ] will be somewhere close to 5,000Hz. This will vary speaker by speaker, though.
LAB 6 REPORT
SECTION I. STOPS
Table 6.1 Acoustic correlates of place of articulation in stops: formant transitions
| Correlate | Stops | [b] | [d] | [g] |
|---|---|---|---|---|
| 1. Formant transitions | [i] context | |||
| [a] context |
Describe or do a basic sketch of the F2 transition (and F1, if
visible) from these voiced stops into the following
vowel.
Q1: How do the different places of articulation differ with respect to the F2 transitions into the following vowels? What causes these differences by place of articulation?
Q2: Looking specifically at [ada] and [idi], do you notice a difference in the formant transitions? What do you think causes this difference?
SECTION II. FRICATIVES
Table 6.2 Acoustic correlates of place of articulation in fricatives
| Peak frequency (Hz) | Amplitude of peak frequency | |
|---|---|---|
| [f] | ||
| [θ] | ||
| [s] | ||
| [ʃ] | ||
| [h] |
Q3: Among the fricatives you measured, which ones are highest/lowest in amplitude? What do you think is the articulatory reason for this?
Q4: Compare the spectral peaks of [s] vs. [ʃ]. Articulatorily, what do you think causes the difference between these two fricatives?
REFERENCES
Q5: Provide a reference and very brief summary of one academic paper that uses the methods covered in this lab.
Disclaimer: The original lab materials on which this lab is based was put together in 2015 (updated 2019) by Sonya Bird, Qian Wang, Sky Onosson, and Allison Benner for the LING 380 Acoustic Phonetics course at the University of Victoria. Their materials are released under a Creative Commons license (CC BY-NC-SA 4.0) which allows for non-commercial use as well as copying and distribution and the creation of derivative works for non-commercial purposes. Thomas Kettig (with assistance from Taylor Potter) has modified these materials as needed for the York University LING 4220 Acoustic Phonetics course.