Lab 4: The Source-Filter Model of Speech
Thomas Kettig, based on work by Sonya Bird et al.
Goal of Lab 4:
The goal of this lab is to explore the relationships between fundamental frequency, harmonics, and formants, as explained by the Source-Filter model of speech. Understanding these relationships is crucial to understanding the properties of the complex wave that is associated with the speech signal.
RECORDING
Record a single sound file, named “Lab4_SourceFilter.wav”, containing the vowel [ɛ] produced at three different pitches: low, mid & high. When recording this, try to get the biggest range in pitch you can (if you can’t remember how to record yourself, refer to Lab 1).
INSTRUCTIONS
SECTION I. FUNDAMENTAL FREQUENCY (F0) OR PITCH
- Measure the fundamental frequency (pitch) in the middle of each [ɛ], using the three techniques described below, and fill out Table 4.1.
TIP:
If you notice that your pitch tracks are not corresponding to the sound that you recorded, such as the middle pitch looking like it’s higher than the final pitch, this means that you might need to adjust your pitch ranges beyond the standard pitch ranges.
Three ways to measure fundamental frequency:
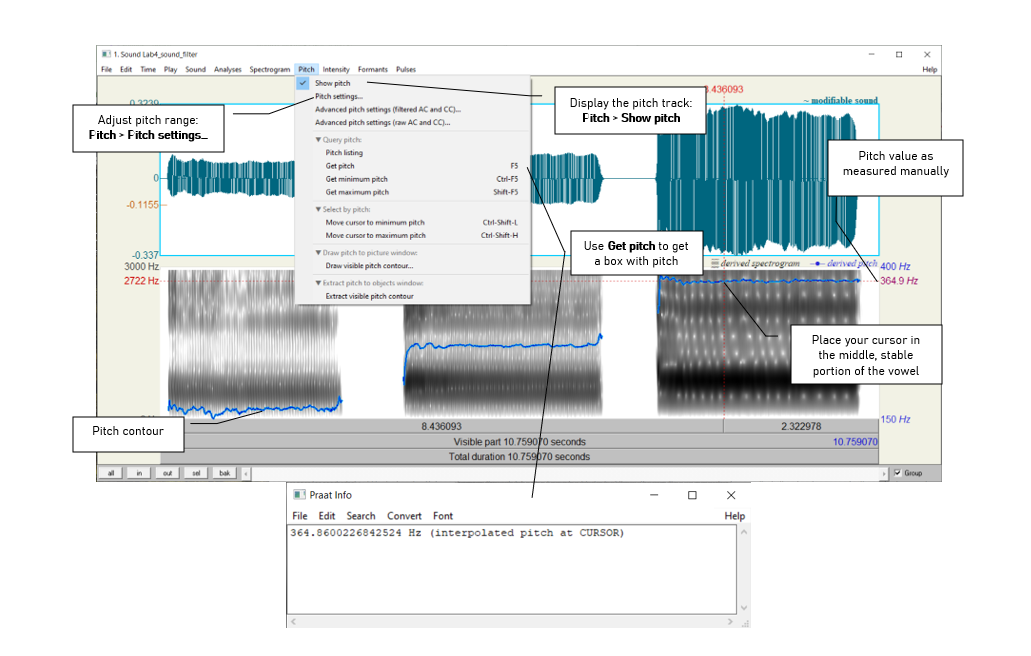
- By displaying the pitch track and having Praat measure the pitch automatically (see Figure 4.1 - this is the technique you used in Lab 3):
- Display the pitch track: Pitch > Show pitch
- Place your cursor in the middle, stable portion of the vowel.
- Go to Pitch > Get pitch: a box will appear with the pitch value in it.
- By displaying the pitch track and measuring pitch manually (see Figure 4.1):
- Display the pitch track: Pitch > Show pitch
- Click on the blue pitch track in the middle of the vowel
- A red horizontal bar should appear, with the pitch value (in dark blue or dark red, depending on your version of Praat) on the right side of the window.
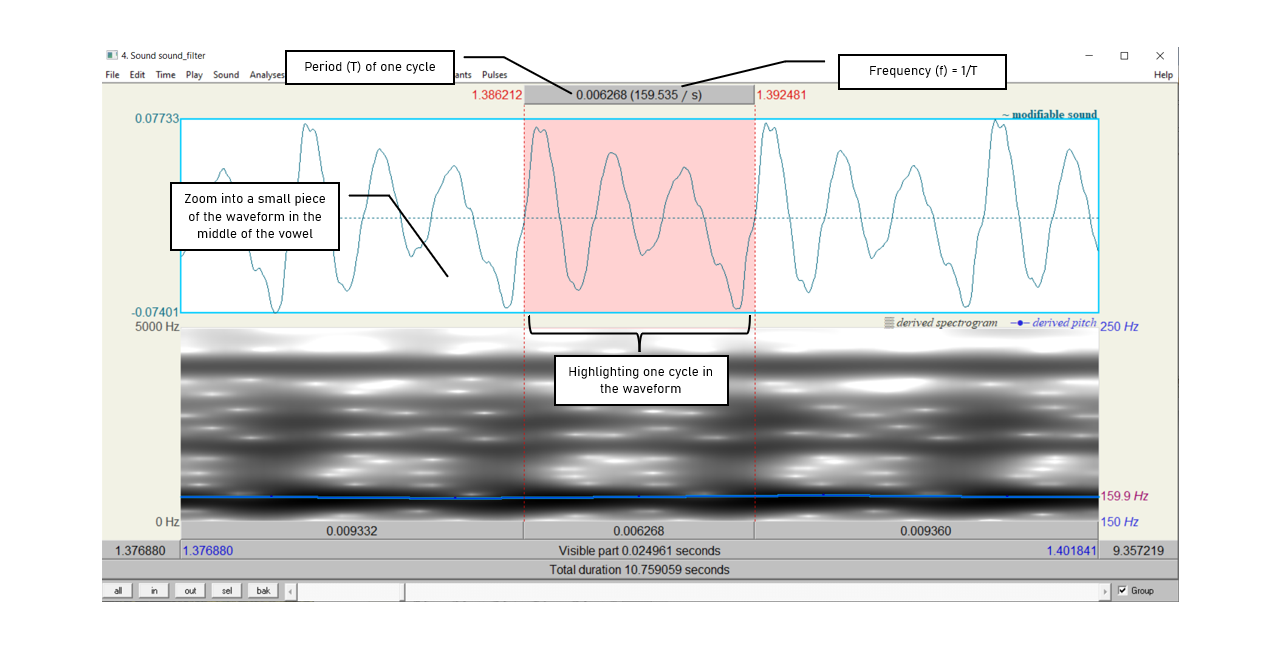
- By looking at the waveform (top of the display) (see Figure 4.2):
- Zoom in to a small piece of the waveform in the middle of the vowel and measure the period by highlighting one complete cycle, going from zero-crossing to zero-crossing, and noting the time associated with it (in the panel above the waveform)
- To get the frequency f from the period T, remeber the formula: f=1÷T. Or if you zoom in enough, the panel above the waveform will include both the period and the frequency (in parentheses), so you don’t have to do any calculations.
TIP:
The fundamental frequency value is always displayed on the right side of the window in dark red (or dark blue, on older versions of Praat); formant frequencies corresponding to the vertical point at which you clicked are displayed on the left side in red – be careful not to get these two confused!You can get Praat to place the cursor at the nearest zero-crossing by using the shortcut Ctrl-0 (zero), or Command-0 on a Mac. Additionally, if you highlight a section of a waveform, the shortcuts Ctrl/Command-, (comma) and Ctrl/Command-. (period) will move the left and right edges of the selection to the closest zero-crossing.
SECTION II. HARMONICS
When our vocal folds vibrate, the result is a complex wave, consisting of the fundamental frequency (which you just measured) plus other higher frequencies, called harmonics. To see these, we need to look at a narrow-band spectrogram, which is more precise along the frequency domain than the default wide-band spectrogram.
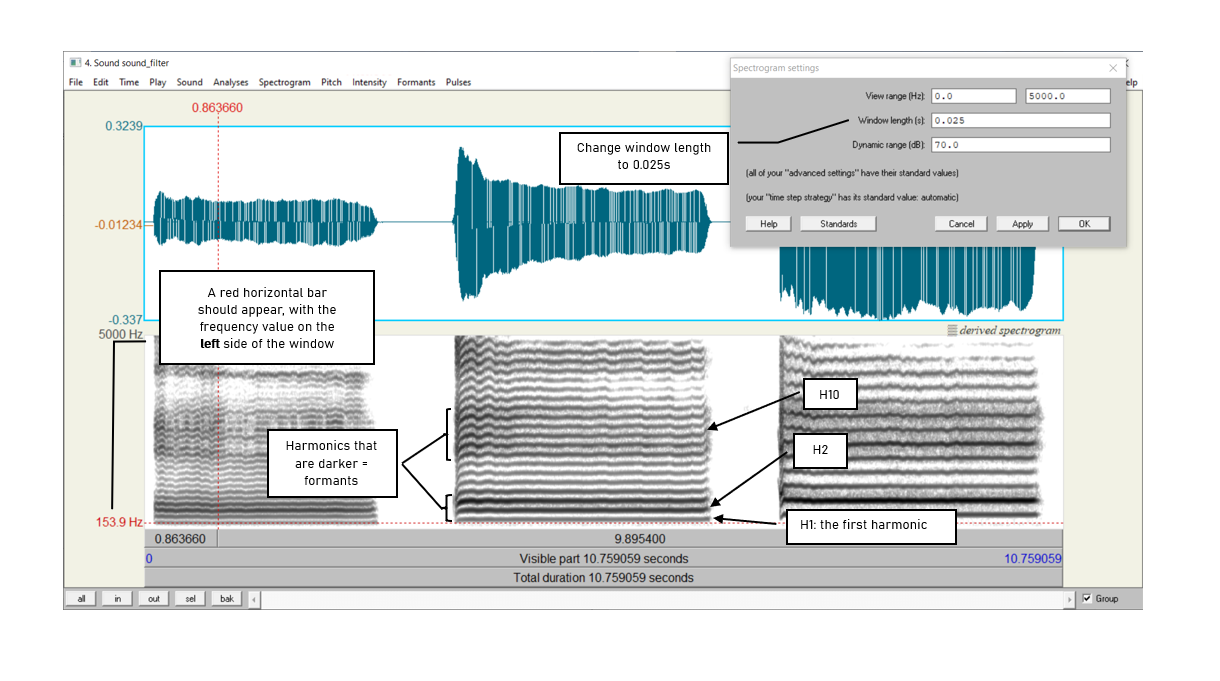
- Display a narrow-band spectrogram:
- Go to: Spectrogram > Spectrogram settings… (see Figure 4.3)
- Change the window length to 0.025s (see Figure 4.3)
(The default window length is 0.005s, which displays a wide-band spectrogram)
NOTE:
The narrow-band and wide-band spectrograms illustrate the time/frequency trade-off. A spectrogram can have very high resolution in frequency (narrow-band) or in time (wide-band), but not in both!
- Looking at each [ɛ], notice the grey horizontal bands: these correspond to harmonics (see Figure 4.3). For each [ɛ] that you recorded, measure the frequency of the first 3 harmonics (H1-H3), plus of the 10th harmonic (H10). Use Table 4.2 to note down your measurements.
- Click on the centre (horizontally) of each harmonic, in the centre (vertically) of each [ɛ].
- A red horizontal bar should appear, with the frequency value on the left side of the window, in red.
TIP:
If you’re having trouble seeing the lower harmonics, you may want to reduce the spectrogram range that Praat is displaying for you: Go to Spectrogram > Spectrogram settings and reduce the maximum of the range from the default of 5000 Hz to 3000 Hz. Remember to set this back to 5000 Hz when you’re finished with this step.
SECTION III. FORMANTS
Looking at the narrow-band spectrogram, you should notice that some harmonics are darker than others (see Figure 4.3). Darkness corresponds to loudness, i.e. the darkest harmonics are the ones that are the most amplified. These amplified harmonics comprise the formants that are characteristic of sonorant speech sounds.
- Now, go back to the wide-band spectrogram:
- Go to: Spectrogram > Spectrogram settings…
- Change the window length back to 0.005 s (the default)
You will see that the formants appear on the wide-band spectrogram as thick dark bands.
- Measure the first and second formants (F1 and F2) in the middle of each [ɛ] using the three techniques outlined below and note down your measurements in Table 4.3.
Three ways to measure formants:
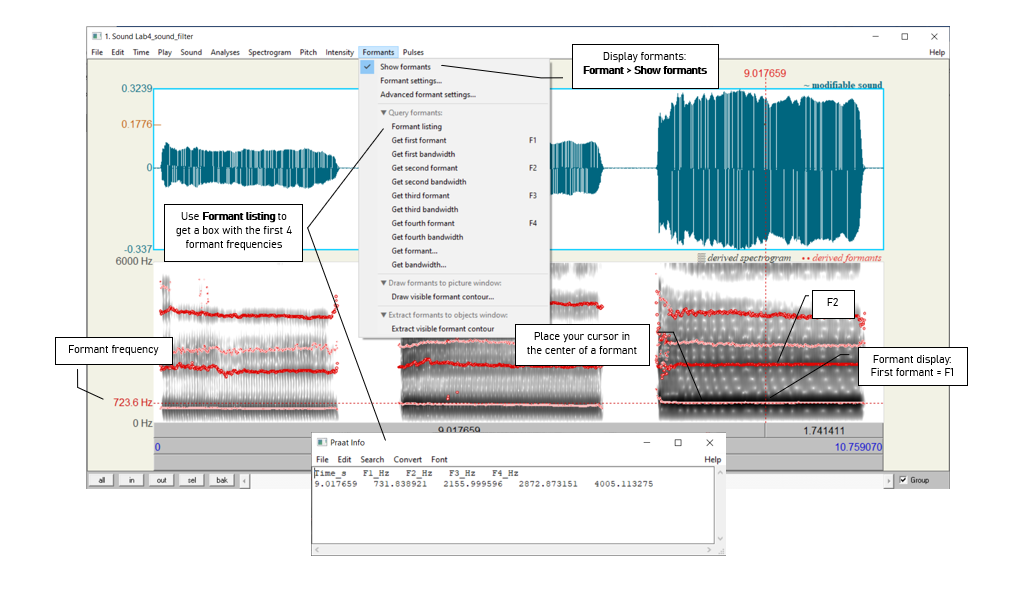
- By displaying the formants (red dots) and having Praat measure the frequency of each formant automatically (see Figure 4.4):
- Display the formant track: Formant > Show formants
- Place your cursor in the middle, stable portion of the vowel
- Go to Formant > Formant listing: a box will appear providing the time point at which the measurement was taken, and values for the first four formants at that time (F1 and F2 are the important ones now).
- By displaying the formants and measuring the frequency of each one manually:
- Display the pitch track: Formant > Show formants
- Place your cursor in the center of each formant, in the middle of the vowel
- A red horizontal bar should appear, with the frequency value on the left side of the window, in red (see Figure 4.4).
- By measuring the frequency without displaying Praat’s formants – this is sometimes easiest if Praat’s formant tracking goes wonky.
- Get rid of Praat’s formant tracking: Formant > Show formants (unclick)
- Place your cursor in the center of each formant, in the middle of the vowel
- A red horizontal bar should appear, with the frequency value on the left side of the window, in red.
TIP: Praat can sometimes track formants incorrectly - it may introduce red and white dots where no formant actually exists, or may miss a formant and fail to track it with dots. Listen to the vowel you’re trying to track, and with your knowledge of approximately what that particular vowel’s formants should look like, deduce whether or not the tracking you’re seeing needs to be adjusted. For instance, if Praat shows your [ɛ] with an F1 and F2 close together, this doesn’t make much sense because [ɛ] should have a relatively high F2 compared to its F1.
To remedy a bad tracking situation, go to Formants > Formant settings and adjust the formant ceiling. A decent baseline for many voices is to look for 5.0 formants with a 5000 Hz to 5500 Hz ceiling: for smaller vocal tracts and for fronter/higher vowels, you may need to raise the formant ceiling to 6000 Hz or more to get good tracking, while for larger vocal tracts and backer/lower vowels you may need to lower the ceiling to 4500 Hz or less. This may take some trial and error.
SECTION IV. THE RELATIONSHIP BETWEEN HARMONICS AND FORMANTS
The relationship between the harmonics and the formants is captured in the source-filter model of speech production. In this last section of the lab, think about what the source and filter might be in this model.
Get rid of the pitch contour: Pitch > Show pitch (unclick)
What is the ordinal number of the harmonic (H2, H5, H8, etc.) that is at the centre of the first formant, for each [ɛ]? Use Table 4.4 to note down your answer. Remember that you’ll need to switch back to a narrow-band spectrogram view to see the harmonics!
LAB 4 REPORT
You may work in pairs for this lab. On eClass, submit: 1) the .wav file you created for this lab (but not the one you downloaded from eClass, if you chose to use that) and 2) a PDF with filled-in tables and answers to the questions below. Make sure the PDF file name follows the convention LING4220_Lab4_LastName_FirstName.pdf or, if submitted as a pair, LING4220_Lab4_LastName1_FirstName1_LastName2_FirstName2.pdf. If submitting as a pair, only one person in each pair should submit the .wav and .pdf files. Remember to always add unit labels (Hz, ms, etc.) to all your tables and figures.
SECTION I. FUNDAMENTAL FREQUENCY (F0) OR PITCH
Table 4.1 Fundamental frequency measurements
| Recording | Pitch contour (automatic) | Pitch contour (manual) | Waveform (one cycle) |
|---|---|---|---|
| [ɛ] low pitch | |||
| [ɛ] mid pitch | |||
| [ɛ] high pitch |
Q1: Which method do you prefer and why?
SECTION II. HARMONICS
Table 4.2 Harmonic measurements
| [ɛ] pitch | H1 | H2 | H3 | H10 |
|---|---|---|---|---|
| Low | ||||
| Mid | ||||
| High |
Q2: Compare the frequency of H1 with the fundamental frequencies measured in 1 above. Based on this comparison, what does the first harmonic (H1) correspond to?
TIP: If you have a very low voice, the first dark line you see may be H2 instead of H1. You may want to adjust the maximum in the spectrogram range so it’s easier to see.
Q3: What is the relationship between the first and subsequent harmonics? (The relationship should be the same across [ɛ]s.)
TIP: Keep in mind there will be some measurement error here, so various relationships may not be as clear as they would be in an ideal world…
SECTION III. FORMANTS
Table 4.3 Formant measurements
| Recording | With formant tracking (automatic) | With formant tracking (manual) | Without formant tracking (manual) |
|---|---|---|---|
| [ɛ] low pitch | F1: | ||
| F2: | |||
| [ɛ] mid pitch | F1: | ||
| F2: | |||
| [ɛ] high pitch | F1: | ||
| F2: |
Q4: Which method do you prefer and why?
Q5: Would you say the formant frequencies are approximately the same or different across [ɛ]s? (Be sure to take into account measurement error and minor articulatory variation between otherwise identical vowels.)
SECTION IV. THE RELATIONSHIP BETWEEN HARMONICS AND FORMANTS
Table 4.4 Harmonics and formants
| Recording | Number of the harmonic corresponding to first dark band in narrow-band spectrogram (e.g. H1, H4) |
|---|---|
| [ɛ] low pitch | |
| [ɛ] mid pitch | |
| [ɛ] high pitch |
Q6: Does this harmonic have the same number
across [ɛ]s? Why or why not?
Q7: What explanation is there for the pattern observed in Table 4.3 and Table 4.4: Why would the harmonic number vary across [ɛ]s (Table 4.4), but the frequency of this harmonic (approximately F1) be consistent across [ɛ]s (Table 4.3)?
REFERENCES
Q8: Provide a reference and very brief summary of one academic paper that uses the methods covered in this lab.
Disclaimer: The original lab materials on which this lab is based was put together in 2015 (updated 2019) by Sonya Bird, Qian Wang, Sky Onosson, and Allison Benner for the LING 380 Acoustic Phonetics course at the University of Victoria. Their materials are released under a Creative Commons license (CC BY-NC-SA 4.0) which allows for non-commercial use as well as copying and distribution and the creation of derivative works for non-commercial purposes. Thomas Kettig (with assistance from Taylor Potter) has modified these materials as needed for the York University LING 4220 Acoustic Phonetics course.